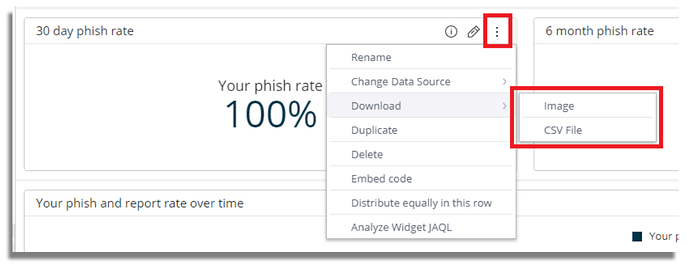
Widgets can be downloaded to share them with others outside of the Infosec IQ platform. For example, you can attach the downloaded files to emails, include them in your own reports, and save them individually for use at a later date.
Table of Contents
- Supported File Formats
- Downloading a Widget
- Downloading a Widget as an Image
- Downloading Widgets to CSV
- Downloading Widgets to PDF
Supported File Formats
Widgets can be downloaded in one of the following formats. Please see the table below for a list of supported formats by widget.
- CSV: Download the data described by the widget in a CSV file. If you have applied any filters, the filtered data is the data included in the file.
- Excel: Download the data described by the widget in an Excel file. The exported data is the data displayed in your widget. This means that any active filters, layout structure, and masks applied to your data are exported as well. For example, if you have modified how currency, percentages, or numbers are formatted in the widget, these are reflected in your exported Excel file. Exporting to Excel maintains your pivot’s layout and structure, and values such as sub-totals, which are not maintained when you export a pivot table to CSV.
- Image: You can download a widget as an image in PNG format. The image size will reflect the size of the widget on the screen when you download it. To create a larger image, enlarge the widget space in the dashboard, or open the widget in edit view, to get a bigger picture.
- PDF: Download the widget as a PDF. You can customize how your PDF is displayed including the table’s orientation and page size. An exported PDF will only contain widget data visible in your dashboard, i.e. if a table has multiple pages then only the first page will be shown in the PDF export. For any large datasets, CSV or Excel should be used.
| Widget Type | Download as PDF | Download as Excel | Download as Image | Download as CSV |
|---|---|---|---|---|
| Area Chart | x | x | ||
| Area Map | x | x | ||
| Bar Chart | x | x | ||
| Box and Whisker Plot | x | x | ||
| Calendar Heatmap | x | x | ||
| Column Chart | x | x | ||
| Funnel Chart | x | x | ||
| Indicator | x | x | ||
| Line Chart | x | x | ||
| Pie Chart | x | x | ||
| Pivot Chart | x | x | x | x |
| Polar | x | x | ||
| Scatter Chart | x | x | ||
| Scatter Map | x | x | ||
| Sunburst | x | x | ||
| Table | x | x | x | |
| Treemap | x | x |
Note: Text widgets cannot be downloaded.
Downloading a Widget
- In the dashboard view, click on the widget’s menu, select Download, and select the relevant file type.
- In the edit widget view, click on the download icon, and select Download, and select the relevant file type.
Downloading a Widget as an Image
Downloading the widget as an image is useful for presentations, your website, and anywhere you want to display the graphical output of your widget. The widget image is downloaded in .png format.To download the widget as an image:
- In dashboard mode, click on the widget’s menu, and select Download > Image.
- In edit widget mode, click on the download icon, and select Download Image.
Note: The image size will reflect the size of the widget on the screen when you download it. To create a larger image you can either enlarge the widget space on the dashboard or open the widget in Edit view to view it at a larger size.
Downloading Widgets to CSV
You can export widgets in the CSV format. Only the displayed (filtered) data is exported according to the currently selected filters.To export a widget to CSV:
- In dashboard mode, click on the widget’s menu, and select Download > CSV File.
- In Edit widget mode, click on the download icon, and select Download CSV.
Downloading Widgets to PDF
You can export pivot table widgets in PDF format. Through the PDF Report Settings page, you can customize how your table is displayed in your PDF report including the table’s orientation and page size.- In the Widget menu for pivot tables or tables, select Download > PDF File. The PDF Report Settings page opens displaying a sample of your Pivot table or table is in the Preview window. When you export your Pivot table or table to PDF, the entire table is included, up to 1,000 rows. The system automatically removes the excess rows.
- You can apply the following settings:
- Paper Size: The size of the email report in the PDF.
- Orientation: The orientation of the widget in the PDF, landscape, or portrait.
- Header: The header is displayed on the top of each page of your PDF report. In the Preview area, click the Header to edit the text, its size, and alignment.
- Footer: Select Page Number to display the page number in the footer on each page of the report.
- Click Download to download your report.

